Thread States: TIMED_WAITING
Introduction
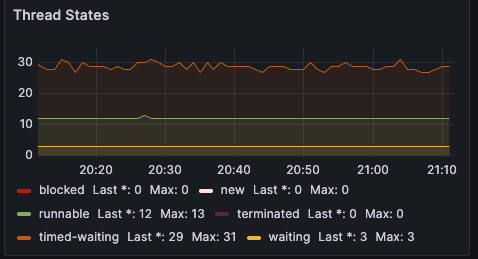
I recently deployed a new application and the application dashboard in grafana was showing: timed-waiting Last *: 29 Max: 30 and I started to wonder whether this is could be some sort of memory leak within the application.
Going Deeper
What does TIMED_WAITING mean?
These threads are not doing CPU work, but are:
Sleeping (
Thread.sleep(...))Waiting with a timeout (e.g.,
Future.get(timeout),CountDownLatch.await(timeout))Or are idle in thread pools with keep-alive timeouts (e.g., HTTP connection pools, worker executors)
When is this OK?
29--30 TIMED_WAITING threads is normal if:
Your app uses scheduled tasks (
ScheduledExecutorService) and mine does.Uses async HTTP clients that keep idle threads alive
Has JDBC connection pool threads waiting for work
Is running under load and these threads are just idling briefly
✅ What's happening under the hood
When you use @EnableScheduling, Spring Boot sets up a default thread pool for scheduled tasks using:
@Scheduled(fixedRate = ..., fixedDelay = ...)
This is powered by a ScheduledExecutorService (typically a ScheduledThreadPoolExecutor), and Spring creates this executor with a default pool size of 1 unless you override it.
But --- and this is the key --- it also uses other background executor services internally (e.g., for metrics, task scheduling, JMX, async events), so your JVM may end up with a few dozen idle threads that sit in TIMED_WAITING, like:
Scheduled executor worker threads
Timer threads
Background bean initialization threads
Pool threads waiting for tasks
🔍 Why TIMED_WAITING threads show up
These threads are often in states like:
java.lang.Thread.State: TIMED_WAITING
    at java.lang.Object.wait(Native Method)
    at java.util.TimerThread.mainLoop(Timer.java:552)
    at java.util.TimerThread.run(Timer.java:505)
or
java.lang.Thread.State: TIMED_WAITING
    at java.lang.Thread.sleep(Native Method)
✅ Is this a problem?
No --- not at all. It's expected.
These threads are idle.
They consume very little CPU or memory.
They're waiting to run your scheduled tasks, or just watching timeouts (e.g., metrics collection, internal monitors).
🧰 Want to reduce or control them?
If you'd like more control (e.g., thread naming, pool sizing), you can override Spring's default scheduler:
@Configuration
@EnableScheduling
public class SchedulerConfig {

    @Bean
    public TaskScheduler taskScheduler() {
        ThreadPoolTaskScheduler scheduler = new ThreadPoolTaskScheduler();
        scheduler.setPoolSize(4); // adjust as needed
        scheduler.setThreadNamePrefix("my-scheduler-");
        scheduler.initialize();
        return scheduler;
    }
}
But unless you're seeing performance issues, there’s no need.
When should you be concerned?
It might be worth investigating if:
| Symptom | Likely Cause |
TIMED_WAITING keeps growing steadily | Threads may not be recycling (thread leak) |
Response times increase with TIMED_WAITING | Threads may be waiting on long timeouts |
Other thread states like BLOCKED are also growing | Lock contention or slow shared resources |
| CPU usage is high despite many threads being "waiting" | Some threads stuck in tight loops between waits |
Next Steps
What to do next
1. Correlate with other JVM thread states
In Grafana:
Add other thread states:
jvm_threads_states_threads{state="RUNNABLE"}BLOCKED,WAITING
If those are low and TIMED_WAITING is flat/stable --- you're probably fine.
Check what threads are doing (optional)
If you're unsure what those threads are, you can:
- Take a thread dump:
jstack <pid> > dump.txt - Search for threads in
TIMED_WAITINGand see who's sleeping and why.
3. Look at executors / pools in your app
Check:
ScheduledExecutorService(timers)Async thread pools (Spring Boot, Netty, etc.)
Connection pools (HikariCP)
ForkJoinPool(if using parallel streams)
Conclusion
🧠 Summary
| Observation | Meaning |
29--30 TIMED_WAITING threads | Normal, expected from scheduling & internal pools |
You use @EnableScheduling with two jobs | Confirms the source |
| No growing count / memory issues | Nothing to worry about |
Generally speaking all is good — your app is behaving as expected.